Terminal Debugging Utilities
- Introduction
- Prerequisites
- Utilities
- top: check running processes for cpu and memory utilisation
- ps: see what processes are running
- strace: monitor interactions between processes
- lsof: list of open files
- netstat: monitoring network traffic
- ifconfig: configure or review your network interfaces
- iftop: monitors network traffic and displays table of bandwidth usage
- iptraf: monitoring network traffic (more visual than
netstat, not as detailed) - tcpdump: network packet sniffer
- wireshark: network packet sniffer and analyser (gui)
- tshark: network packet sniffer and analyser
- telnet: utility for communicating with another host
- Honorable mentions
- Conclusion
Introduction
Not all programmers need to get their hands dirty and have to dig deep into what exactly their applications or services are doing at a lower/network level.
This is why programmers work with programming languages, as they provide a nice high-level abstraction layer that protects us from a lot of these concerns.
But regardless if you’re a client-side developer or a server-side developer, at some point your application will start misbehaving and it can be useful to have experience using command-line/terminal based tools to help you debug what’s going on.
That is what I want to briefly cover today: a few select programs that you may find useful to have in your debugging toolbox. I won’t claim to be an expert with any of these, but I’ve had to use these tools at some point or another so I at least know what I have available to me whenever things start going haywire.
I’d encourage you to do follow-up reading once you’ve gone through this post, and to experiment with these tools if there are any in particular that you find interesting.
Agony of Choice
You are going to find that some of the tools I mention, have a lot of crossover behaviour between them.
One of the main points of confusion for people, when given the choice of lots of different utility tools, is: when/why should I use this over another very similar tool?
The answer: it depends (as with everything in life).
Sometimes it can just be a personal preference. You’re happy using tool x, which can sort of do that ’thing’ you need it to, but maybe tool x isn’t quite as good at showing you the ’thing’ as tool y (which was designed specifically to solve the ’thing’ problem); but hey, tool x is good enough at it and it also allows me to inspect y and z problems (which are things I look at the majority of the time).
Just be aware that that there will be crossover functionality, and that on occasions certain tools might only have slight additions that could be useful to you depending on the problem you’re trying to debug.
Deprecated Commands?
It was brought to my attention by Aidy Lewis that tools such as ifconfig and netstat have since been deprecated in favour of other tools. See here for the details of what the replacement tools are.
Prerequisites
TCP and HTTP
The fact is in order to use tools such as tcpdump, telnet or netstat you do need to understand the basics of how the TCP and HTTP protocols work in order to utilise these programs fully.
As far as other tools are concerned, you may need to understand some networking basics. I mean, I know very little, but I know just enough to muddle along when I need to.
I’ll be covering how I’ve used these tools but not really much more beyond that, so you may need to do some additional reading in order to appreciate what these tools offer (outside of my own experience with them).
OSI Model
Finally, before we get going, it’s worth taking a moment to consider the OSI Model. What this model represents are the different layers of a system. From the very real hardware level (e.g. physical cables that make the interwebs work) right up to the software level.
Here is a table matrix that attempts to identify these ’layers':
| OSI Model | ||||
|---|---|---|---|---|
| Layer | Protocol data unit (PDU) | Function | Examples | |
| Host layers |
7. Application | Data | High-level APIs, including resource sharing, remote file access | HTTP, NFS, FTP, Telnet, SMTP, SSH |
| 6. Presentation | Translation of data between a networking service and an application; including character encoding, data compression and encryption/decryption | S/MIME, TLS | ||
| 5. Session | Managing communication sessions, i.e. continuous exchange of information in the form of multiple back-and-forth transmissions between two nodes | RPC, SCP, PAP | ||
| 4. Transport | Segment (TCP) / Datagram (UDP) | Reliable transmission of data segments between points on a network, including segmentation, acknowledgement and multiplexing | TCP, UDP, NBF | |
| Media layers |
3. Network | Packet | Structuring and managing a multi-node network, including addressing, routing and traffic control | IPv4, IPv6, ICMP, IPsec, CLNP, DDP |
| 2. Data link | Frame | Reliable transmission of data frames between two nodes connected by a physical layer | IEEE 802.2, L2TP, LLDP, IEEE 802 MAC layers (Ethernet, IEEE 802.11, etc.), PPP, ATM, MPLS | |
| 1. Physical | Bit | Transmission and reception of raw bit streams over a physical medium | DOCSIS, DSL, IEEE 802 physical layers (Ethernet, IEEE 802.11, etc.), ISDN, RS-232 | |
Note: you’ll find many differing versions of the OSI Model (i.e. the layers described are always the same, but you may see more or less protocols defined depending on what version you look at), this is just one such version copied vertabim from Wikipedia
The reason this is useful, is because you can identify which layer the relevant tools are operating at. Tools like netstat operate at layer four (transport: tcp), whereas telnet operates at layer seven (application: it actually has its own protocol telnet).
When debugging an issue, if you know the problem space is a particular layer of the OSI model, then you’ll have an easier time identifying which tool is best suited to the investigation.
Utilities
There are many different utilities, some provided as built-ins to your OS, others might be GNU flavoured or home grown (e.g. they can be built using a myriad of programming languages) and which you have to download separately.
The ones listed below are a selection of tools I find particularly useful for different scenarios. But they’re not all available on the Mac OS (which is what I use, and which - I’m making a massive assumption - you are likely using too).
I do provide basic installation instructions for some of the tools that aren’t available for the Mac OS (either natively or at all) and for those tools that aren’t available for your OS, I would recommend using Docker for testing them out.
I’d suggest for the purpose of this article to try one of the following if you don’t want/use Mac OS:
docker run -it centos /bin/bash

# or

docker run -it ubuntu /bin/bash
Also, the usage between Mac OS and Linux can vary
Example:top -non Mac shows only n number of items; Linux runs n number of ticks before stopping
If you notice something different, then it’ll likely be the OS
But ultimately the examples I give are for Mac OS (unless stated otherwise)
With all that out of the way, let’s begin…
top
Summary: displays running processes with cpu and memory utilisation
The top command displays processor activity and also displays tasks managed by the kernel in real-time. If you have a cluster of nodes that are setup to scale up based on either CPU or Memory usage, then your first starting point will be to jump onto a running instance and check the different processes running and what their consumption is.
Or maybe an application on your laptop is running very slowly? You can inspect its CPU consumption to see if it’s doing something odd and maxing out at 99%

Here are some basic commands:
-
top -user <user>: filter processes by those run by specified usere.g.
top -user $(who | awk 'NR==1 {print $1}') -
top -n 10: stops command running after 10 intervalsotherwise runs forever or until
<Ctrl-c>(SIGINT“interrupt” signal received)
You can change which column controls the order display (the default being CPU) by typing o and then typing the column name. For example:
+command: order by the COMMAND column (ascending order)-command: order by the COMMAND column (descending order)
+is implied (so no need to type it)
The following key strokes can be executed whilst top is running…
z: toggles on/off ability to have currently running processes highlighted
Non-Mac
On the non-Mac version of top you may find that you need the output to show you the complete path to the running program (which can be handy if you don’t recognise the program, and want to know where it’s located):
c: toggles on/off absolute path for the COMMAND
Similarly for non-Mac versions you can dynamically change the refresh rate:
d: change interval for screen/data refresh
Finally one other useful thing for non-Mac versions is the ability to kill a process you don’t like the look of:
-
k: followed by PID of process you want to kill -
1: toggles a breakdown of the CPU usage (rather than showing aggregated value)
I mention the above non-Mac options because when debugging on a remote server, chances are you’ll need some of those details more.
Failing all that you could just install the man pages and double check the available options (or run a Docker container and double check them):
apt-get update && apt-get install man
There are also some pretty fancy alternatives, such as:
ps
Summary: displays snapshot of running processes
The ps command is useful for seeing ‘at a glance’ what process id’s have been provided to different programs and which user started them (as well as the relationship between processes).
Majority of the time you’ll use ps just to identify the process id (pid) so you can then utilise another tool for inspecting the relevant process.
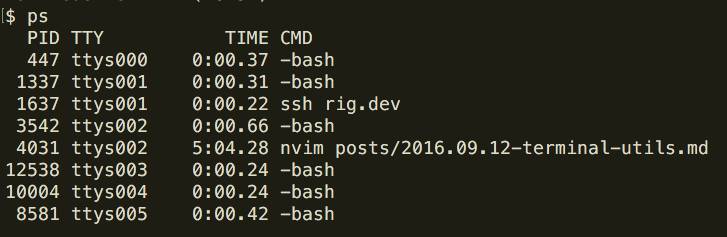
The differences between ps and top are subtle, both display details about active processes (albeit in different formats). But top is continuous whereas ps is just a snapshop.
The ps command also offers some more advanced display options, not just a table matrix, and these can help visualise the parent/children relationship for particular processes.
Here are some useful commands you can try:
ps aux: shows all running processes (even those without a tty or are not owned by you)ps axjf: shows parent process (ppids) & nested children pids with tree formatting
Note: the
foption doesn’t work the same on Mac OS (man psfor details)
strace
Summary: monitors interactions between processes, by highlighting what syscalls are being made
So strace is awesome for understanding exactly what your application is doing. If you have (just for example) a Python or Ruby app, then you should know that all the function calls it makes are actually abstractions provided by the language.
Most high-level languages are written in C, and so those abstracted functions will end up calling some internal C functions and those C functions will end up making OS level system calls.
It’s these ‘system calls’ that you’ll end up tracing/tracking with strace.
This utility isn’t available on Mac OS, so you’ll need Linux:
With Ubuntu:
apt-get update && apt-get install strace
With CentOS:
yum install strace
Mac OS has
dtracebut it does use quite different commands fromstrace
Although I have seen articles online that help translate
You can run strace against a new process, like so:
strace ls -l
But you can also attach strace to an already running process! This is great for debugging an application that’s misbehaving out in the wild. You would do that like so:
strace -p <process_id>
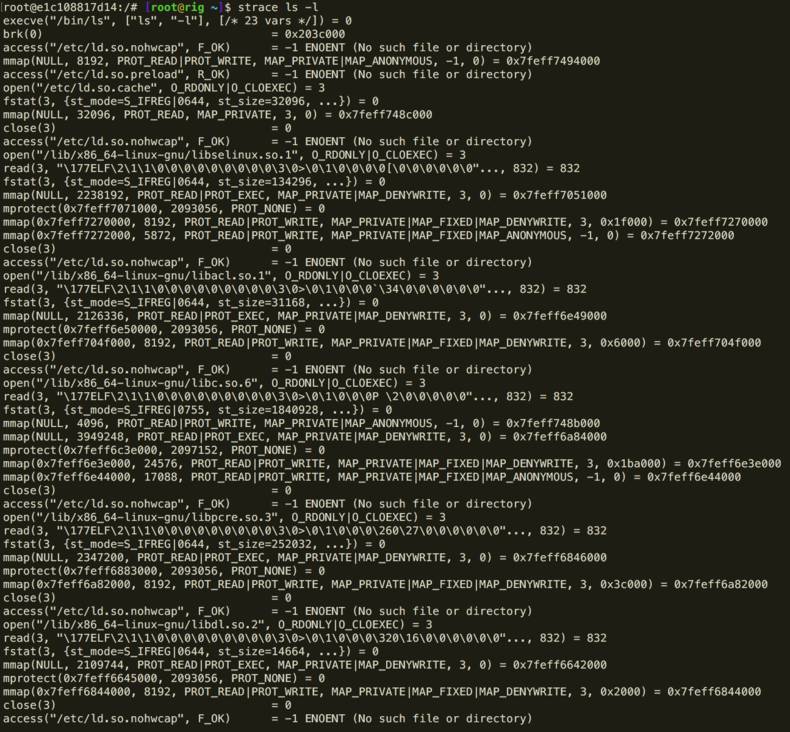
So let’s consider a simple example where we want to see what the shell command ls -l is actually doing. First let’s trace it to get an idea of the output you’ll see:
strace ls -l

execve("/bin/ls", ["ls", "-l"], [/* 23 vars */]) = 0
brk(0)                                  = 0x109a000
access("/etc/ld.so.nohwcap", F_OK)      = -1 ENOENT (No such file or directory)
mmap(NULL, 8192, PROT_READ|PROT_WRITE, MAP_PRIVATE|MAP_ANONYMOUS, -1, 0) = 0x7f22f946a000
access("/etc/ld.so.preload", R_OK)      = -1 ENOENT (No such file or directory)
open("/etc/ld.so.cache", O_RDONLY|O_CLOEXEC) = 3
fstat(3, {st_mode=S_IFREG|0644, st_size=32096, ...}) = 0
mmap(NULL, 32096, PROT_READ, MAP_PRIVATE, 3, 0) = 0x7f22f9462000
close(3)                                = 0
access("/etc/ld.so.nohwcap", F_OK)      = -1 ENOENT (No such file or directory)
open("/lib/x86_64-linux-gnu/libselinux.so.1", O_RDONLY|O_CLOEXEC) = 3
read(3, "\177ELF\2\1\1\0\0\0\0\0\0\0\0\0\3\0>\0\1\0\0\0\0[\0\0\0\0\0\0"..., 832) = 832
fstat(3, {st_mode=S_IFREG|0644, st_size=134296, ...}) = 0
mmap(NULL, 2238192, PROT_READ|PROT_EXEC, MAP_PRIVATE|MAP_DENYWRITE, 3, 0) = 0x7f22f9027000
mprotect(0x7f22f9047000, 2093056, PROT_NONE) = 0
mmap(0x7f22f9246000, 8192, PROT_READ|PROT_WRITE, MAP_PRIVATE|MAP_FIXED|MAP_DENYWRITE, 3, 0x1f000) = 0x7f22f9246000
mmap(0x7f22f9248000, 5872, PROT_READ|PROT_WRITE, MAP_PRIVATE|MAP_FIXED|MAP_ANONYMOUS, -1, 0) = 0x7f22f9248000
close(3)                                = 0
access("/etc/ld.so.nohwcap", F_OK)      = -1 ENOENT (No such file or directory)
open("/lib/x86_64-linux-gnu/libacl.so.1", O_RDONLY|O_CLOEXEC) = 3
read(3, "\177ELF\2\1\1\0\0\0\0\0\0\0\0\0\3\0>\0\1\0\0\0`\34\0\0\0\0\0\0"..., 832) = 832
fstat(3, {st_mode=S_IFREG|0644, st_size=31168, ...}) = 0
mmap(NULL, 2126336, PROT_READ|PROT_EXEC, MAP_PRIVATE|MAP_DENYWRITE, 3, 0) = 0x7f22f8e1f000
mprotect(0x7f22f8e26000, 2093056, PROT_NONE) = 0
mmap(0x7f22f9025000, 8192, PROT_READ|PROT_WRITE, MAP_PRIVATE|MAP_FIXED|MAP_DENYWRITE, 3, 0x6000) = 0x7f22f9025000
close(3)                                = 0
access("/etc/ld.so.nohwcap", F_OK)      = -1 ENOENT (No such file or directory)
open("/lib/x86_64-linux-gnu/libc.so.6", O_RDONLY|O_CLOEXEC) = 3
read(3, "\177ELF\2\1\1\0\0\0\0\0\0\0\0\0\3\0>\0\1\0\0\0P \2\0\0\0\0\0"..., 832) = 832
fstat(3, {st_mode=S_IFREG|0755, st_size=1840928, ...}) = 0
mmap(NULL, 4096, PROT_READ|PROT_WRITE, MAP_PRIVATE|MAP_ANONYMOUS, -1, 0) = 0x7f22f9461000
mmap(NULL, 3949248, PROT_READ|PROT_EXEC, MAP_PRIVATE|MAP_DENYWRITE, 3, 0) = 0x7f22f8a5a000
mprotect(0x7f22f8c14000, 2097152, PROT_NONE) = 0
mmap(0x7f22f8e14000, 24576, PROT_READ|PROT_WRITE, MAP_PRIVATE|MAP_FIXED|MAP_DENYWRITE, 3, 0x1ba000) = 0x7f22f8e14000
mmap(0x7f22f8e1a000, 17088, PROT_READ|PROT_WRITE, MAP_PRIVATE|MAP_FIXED|MAP_ANONYMOUS, -1, 0) = 0x7f22f8e1a000
close(3)                                = 0
access("/etc/ld.so.nohwcap", F_OK)      = -1 ENOENT (No such file or directory)
open("/lib/x86_64-linux-gnu/libpcre.so.3", O_RDONLY|O_CLOEXEC) = 3
read(3, "\177ELF\2\1\1\0\0\0\0\0\0\0\0\0\3\0>\0\1\0\0\0\260\27\0\0\0\0\0\0"..., 832) = 832
fstat(3, {st_mode=S_IFREG|0644, st_size=252032, ...}) = 0
mmap(NULL, 2347200, PROT_READ|PROT_EXEC, MAP_PRIVATE|MAP_DENYWRITE, 3, 0) = 0x7f22f881c000
mprotect(0x7f22f8859000, 2093056, PROT_NONE) = 0
mmap(0x7f22f8a58000, 8192, PROT_READ|PROT_WRITE, MAP_PRIVATE|MAP_FIXED|MAP_DENYWRITE, 3, 0x3c000) = 0x7f22f8a58000
close(3)                                = 0
access("/etc/ld.so.nohwcap", F_OK)      = -1 ENOENT (No such file or directory)
open("/lib/x86_64-linux-gnu/libdl.so.2", O_RDONLY|O_CLOEXEC) = 3
read(3, "\177ELF\2\1\1\0\0\0\0\0\0\0\0\0\3\0>\0\1\0\0\0\320\16\0\0\0\0\0\0"..., 832) = 832
fstat(3, {st_mode=S_IFREG|0644, st_size=14664, ...}) = 0
mmap(NULL, 2109744, PROT_READ|PROT_EXEC, MAP_PRIVATE|MAP_DENYWRITE, 3, 0) = 0x7f22f8618000
mprotect(0x7f22f861b000, 2093056, PROT_NONE) = 0
mmap(0x7f22f881a000, 8192, PROT_READ|PROT_WRITE, MAP_PRIVATE|MAP_FIXED|MAP_DENYWRITE, 3, 0x2000) = 0x7f22f881a000
close(3)                                = 0
access("/etc/ld.so.nohwcap", F_OK)      = -1 ENOENT (No such file or directory)
open("/lib/x86_64-linux-gnu/libattr.so.1", O_RDONLY|O_CLOEXEC) = 3
read(3, "\177ELF\2\1\1\0\0\0\0\0\0\0\0\0\3\0>\0\1\0\0\0\300\20\0\0\0\0\0\0"..., 832) = 832
fstat(3, {st_mode=S_IFREG|0644, st_size=18624, ...}) = 0
mmap(NULL, 4096, PROT_READ|PROT_WRITE, MAP_PRIVATE|MAP_ANONYMOUS, -1, 0) = 0x7f22f9460000
mmap(NULL, 2113760, PROT_READ|PROT_EXEC, MAP_PRIVATE|MAP_DENYWRITE, 3, 0) = 0x7f22f8413000
mprotect(0x7f22f8417000, 2093056, PROT_NONE) = 0
mmap(0x7f22f8616000, 8192, PROT_READ|PROT_WRITE, MAP_PRIVATE|MAP_FIXED|MAP_DENYWRITE, 3, 0x3000) = 0x7f22f8616000
close(3)                                = 0
mmap(NULL, 4096, PROT_READ|PROT_WRITE, MAP_PRIVATE|MAP_ANONYMOUS, -1, 0) = 0x7f22f945f000
mmap(NULL, 8192, PROT_READ|PROT_WRITE, MAP_PRIVATE|MAP_ANONYMOUS, -1, 0) = 0x7f22f945d000
arch_prctl(ARCH_SET_FS, 0x7f22f945d840) = 0
mprotect(0x7f22f8e14000, 16384, PROT_READ) = 0
mprotect(0x7f22f8616000, 4096, PROT_READ) = 0
mprotect(0x7f22f881a000, 4096, PROT_READ) = 0
mprotect(0x7f22f8a58000, 4096, PROT_READ) = 0
mprotect(0x7f22f9025000, 4096, PROT_READ) = 0
mprotect(0x7f22f9246000, 4096, PROT_READ) = 0
mprotect(0x619000, 4096, PROT_READ)     = 0
mprotect(0x7f22f946c000, 4096, PROT_READ) = 0
munmap(0x7f22f9462000, 32096)           = 0
statfs("/sys/fs/selinux", 0x7ffca795ea30) = -1 ENOENT (No such file or directory)
statfs("/selinux", 0x7ffca795ea30)      = -1 ENOENT (No such file or directory)
brk(0)                                  = 0x109a000
brk(0x10bb000)                          = 0x10bb000
open("/proc/filesystems", O_RDONLY)     = 3
fstat(3, {st_mode=S_IFREG|0444, st_size=0, ...}) = 0
mmap(NULL, 4096, PROT_READ|PROT_WRITE, MAP_PRIVATE|MAP_ANONYMOUS, -1, 0) = 0x7f22f9469000
read(3, "nodev\tsysfs\nnodev\trootfs\nnodev\tr"..., 1024) = 384
read(3, "", 1024)                       = 0
close(3)                                = 0
munmap(0x7f22f9469000, 4096)            = 0
open("/usr/lib/locale/locale-archive", O_RDONLY|O_CLOEXEC) = 3
fstat(3, {st_mode=S_IFREG|0644, st_size=1607664, ...}) = 0
mmap(NULL, 1607664, PROT_READ, MAP_PRIVATE, 3, 0) = 0x7f22f92d4000
close(3)                                = 0
ioctl(1, SNDCTL_TMR_TIMEBASE or SNDRV_TIMER_IOCTL_NEXT_DEVICE or TCGETS, {B38400 opost isig icanon echo ...}) = 0
ioctl(1, TIOCGWINSZ, {ws_row=53, ws_col=172, ws_xpixel=1895, ws_ypixel=1171}) = 0
open("/usr/share/locale/locale.alias", O_RDONLY|O_CLOEXEC) = 3
fstat(3, {st_mode=S_IFREG|0644, st_size=2570, ...}) = 0
mmap(NULL, 4096, PROT_READ|PROT_WRITE, MAP_PRIVATE|MAP_ANONYMOUS, -1, 0) = 0x7f22f9469000
read(3, "# Locale name alias data base.\n#"..., 4096) = 2570
read(3, "", 4096)                       = 0
close(3)                                = 0
munmap(0x7f22f9469000, 4096)            = 0
open("/usr/share/locale/en_US.UTF-8/LC_TIME/coreutils.mo", O_RDONLY) = -1 ENOENT (No such file or directory)
open("/usr/share/locale/en_US.utf8/LC_TIME/coreutils.mo", O_RDONLY) = -1 ENOENT (No such file or directory)
open("/usr/share/locale/en_US/LC_TIME/coreutils.mo", O_RDONLY) = -1 ENOENT (No such file or directory)
open("/usr/share/locale/en.UTF-8/LC_TIME/coreutils.mo", O_RDONLY) = -1 ENOENT (No such file or directory)
open("/usr/share/locale/en.utf8/LC_TIME/coreutils.mo", O_RDONLY) = -1 ENOENT (No such file or directory)
open("/usr/share/locale/en/LC_TIME/coreutils.mo", O_RDONLY) = -1 ENOENT (No such file or directory)
open("/usr/share/locale-langpack/en_US.UTF-8/LC_TIME/coreutils.mo", O_RDONLY) = -1 ENOENT (No such file or directory)
open("/usr/share/locale-langpack/en_US.utf8/LC_TIME/coreutils.mo", O_RDONLY) = -1 ENOENT (No such file or directory)
open("/usr/share/locale-langpack/en_US/LC_TIME/coreutils.mo", O_RDONLY) = -1 ENOENT (No such file or directory)
open("/usr/share/locale-langpack/en.UTF-8/LC_TIME/coreutils.mo", O_RDONLY) = -1 ENOENT (No such file or directory)
open("/usr/share/locale-langpack/en.utf8/LC_TIME/coreutils.mo", O_RDONLY) = -1 ENOENT (No such file or directory)
open("/usr/share/locale-langpack/en/LC_TIME/coreutils.mo", O_RDONLY) = -1 ENOENT (No such file or directory)
open("/usr/lib/x86_64-linux-gnu/gconv/gconv-modules.cache", O_RDONLY) = 3
fstat(3, {st_mode=S_IFREG|0644, st_size=26258, ...}) = 0
mmap(NULL, 26258, PROT_READ, MAP_SHARED, 3, 0) = 0x7f22f9463000
close(3)                                = 0
openat(AT_FDCWD, ".", O_RDONLY|O_NONBLOCK|O_DIRECTORY|O_CLOEXEC) = 3
getdents(3, /* 10 entries */, 32768)    = 296
getdents(3, /* 0 entries */, 32768)     = 0
close(3)                                = 0
open("/usr/share/locale/en_US.UTF-8/LC_MESSAGES/coreutils.mo", O_RDONLY) = -1 ENOENT (No such file or directory)
open("/usr/share/locale/en_US.utf8/LC_MESSAGES/coreutils.mo", O_RDONLY) = -1 ENOENT (No such file or directory)
open("/usr/share/locale/en_US/LC_MESSAGES/coreutils.mo", O_RDONLY) = -1 ENOENT (No such file or directory)
open("/usr/share/locale/en.UTF-8/LC_MESSAGES/coreutils.mo", O_RDONLY) = -1 ENOENT (No such file or directory)
open("/usr/share/locale/en.utf8/LC_MESSAGES/coreutils.mo", O_RDONLY) = -1 ENOENT (No such file or directory)
open("/usr/share/locale/en/LC_MESSAGES/coreutils.mo", O_RDONLY) = -1 ENOENT (No such file or directory)
open("/usr/share/locale-langpack/en_US.UTF-8/LC_MESSAGES/coreutils.mo", O_RDONLY) = -1 ENOENT (No such file or directory)
open("/usr/share/locale-langpack/en_US.utf8/LC_MESSAGES/coreutils.mo", O_RDONLY) = -1 ENOENT (No such file or directory)
open("/usr/share/locale-langpack/en_US/LC_MESSAGES/coreutils.mo", O_RDONLY) = -1 ENOENT (No such file or directory)
open("/usr/share/locale-langpack/en.UTF-8/LC_MESSAGES/coreutils.mo", O_RDONLY) = -1 ENOENT (No such file or directory)
open("/usr/share/locale-langpack/en.utf8/LC_MESSAGES/coreutils.mo", O_RDONLY) = -1 ENOENT (No such file or directory)
open("/usr/share/locale-langpack/en/LC_MESSAGES/coreutils.mo", O_RDONLY) = -1 ENOENT (No such file or directory)
fstat(1, {st_mode=S_IFCHR|0620, st_rdev=makedev(136, 2), ...}) = 0
mmap(NULL, 4096, PROT_READ|PROT_WRITE, MAP_PRIVATE|MAP_ANONYMOUS, -1, 0) = 0x7f22f9462000
write(1, "total 0\n", 8total 0
)                = 8
close(1)                                = 0
munmap(0x7f22f9462000, 4096)            = 0
close(2)                                = 0
exit_group(0)                           = ?
+++ exited with 0 +++
OK… so that’s a lot of noise. So let’s see if we can’t quieten it down a bit by using the count flag -c:
strace -c ls -l

total 0
% time     seconds  usecs/call     calls    errors syscall
------ ----------- ----------- --------- --------- ----------------
  0.00    0.000000           0        10           read
  0.00    0.000000           0         1           write
  0.00    0.000000           0        35        24 open
  0.00    0.000000           0        14           close
  0.00    0.000000           0        12           fstat
  0.00    0.000000           0        25           mmap
  0.00    0.000000           0        14           mprotect
  0.00    0.000000           0         4           munmap
  0.00    0.000000           0         3           brk
  0.00    0.000000           0         2           ioctl
  0.00    0.000000           0         8         8 access
  0.00    0.000000           0         1           execve
  0.00    0.000000           0         2           getdents
  0.00    0.000000           0         2         2 statfs
  0.00    0.000000           0         1           arch_prctl
  0.00    0.000000           0         1           openat
------ ----------- ----------- --------- --------- ----------------
100.00    0.000000                   135        34 total
Now that’s better. We get a good overview of what syscalls have been made by the ls program, how many times and the overall time involved for each type of function.
But as you can see, when tracing a program that only lists the files in a directory (i.e. ls -l), you’re not going to see much in the way of ’time’. So let’s use lsof (will read more about this later), which can take a few seconds to run:
strace -c lsof

% time     seconds  usecs/call     calls    errors syscall
------ ----------- ----------- --------- --------- ----------------
 66.25    0.018456           7      2479           write
  7.11    0.001980           1      1405           read
  4.44    0.001237           1      2067        12 stat
  3.77    0.001051           1      2074      1021 close
  3.61    0.001007           4       244           alarm
  3.08    0.000857           2       543           munmap
  2.18    0.000608           2       244           rt_sigaction
  2.06    0.000575         575         1           wait4
  1.72    0.000479           1       554           fstat
  1.70    0.000474           1       875        57 readlink
  1.30    0.000363           0       834        20 open
  0.84    0.000235           0       507           lstat
  0.83    0.000230           0       568           mmap
  0.60    0.000167           1       222           openat
  0.42    0.000116           8        14           recvmsg
  0.09    0.000024           0       444           getdents
  0.00    0.000000           0         2           poll
  0.00    0.000000           0        17           lseek
  0.00    0.000000           0        18           mprotect
  0.00    0.000000           0        13           brk
  0.00    0.000000           0         1           ioctl
  0.00    0.000000           0        11        11 access
  0.00    0.000000           0         2           pipe
  0.00    0.000000           0         1           getpid
  0.00    0.000000           0        14           socket
  0.00    0.000000           0         7         6 connect
  0.00    0.000000           0         8           sendto
  0.00    0.000000           0         1           recvfrom
  0.00    0.000000           0         7           setsockopt
  0.00    0.000000           0         1           clone
  0.00    0.000000           0         1           execve
  0.00    0.000000           0         5           uname
  0.00    0.000000           0         1           umask
  0.00    0.000000           0         1           getrlimit
  0.00    0.000000           0         1           getuid
  0.00    0.000000           0         1           getgid
  0.00    0.000000           0         1           geteuid
  0.00    0.000000           0         1           getegid
  0.00    0.000000           0         1           arch_prctl
------ ----------- ----------- --------- --------- ----------------
100.00    0.027859                 13191      1127 total
OK that output is a bit more practical, as we can see that the write syscall took approximately 66% of the overall time of the program to run. If this was your own application you might consider that an issue worth delving into more deeply.
If you want to get a rough idea for what some of these system calls mean, then use the below quick guide (otherwise Google is your friend):
| Syscall | What it does? |
|---|---|
| read | read bytes from a file descriptor (file, socket) |
| write | write bytes from a file descriptor (file, socket) |
| open | open a file (returns a file descriptor) |
| close | close a file descriptor |
| fork | create a new process (current process is forked) |
| exec | execute a new program |
| connect | connect to a network host |
| accept | accept a network connection |
| stat | read file statistics |
| ioctl | set I/O properties, or other miscellaneous functions |
| mmap | map a file to the process memory address space |
| brk | extend the heap pointer |
For debugging with strace I’d suggest using the -c flag first so you get a feel for any particular system calls that stand out as being quite odd.
Maybe you notice a lot of network connections being opened and your app is showing signs of struggling with throughput. So you might then use strace without the -c so you could delve into the specific details.
If you’re debugging on a remote server that’s running a web app, you might attach strace to the running server process and then start manually curling endpoints to see what sort of reaction the server has.
Maybe you only want to look out for certain types of system calls. In that case you can utilise filters (-e). In the following example we’re only interested in the open, connect and access syscalls:
strace -e trace=open,connect,access lsof
You can also use ! to negate the filter (see man strace for more details)
Note: if you try to use
grepinstead of-ethen you’ll need to ensure you redirect stderr to stdout or you wont see any output as strace sends to stderr by default; meaning you’d need to execute something likestrace uptime 2>&1 | grep open
You might also find that using the -t flag useful for tracking when the call was made:
strace -t -e trace=access lsof

19:01:00 access("/etc/ld.so.nohwcap", F_OK) = -1 ENOENT (No such file or directory)
19:01:00 access("/etc/ld.so.preload", R_OK) = -1 ENOENT (No such file or directory)
19:01:00 access("/etc/ld.so.nohwcap", F_OK) = -1 ENOENT (No such file or directory)
As you can see strace is a really useful tool when the time comes.
…and the time will come.
By the way, you should be careful with backgrounded processes. If you attach to a backgrounded process running in the same shell instance as your strace execution, then you’ll be locked up.
Note: although
straceis amazing, you might also want to read this article that discusses the oft-ignored performance overhead of using it in production
lsof
Summary: lists open files
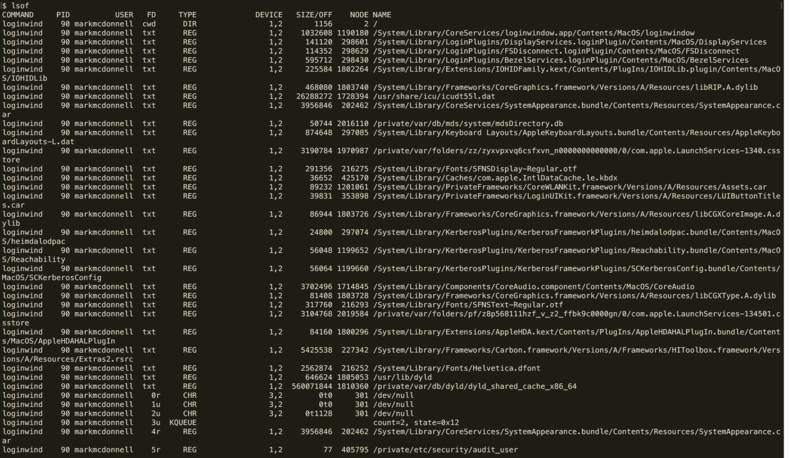
So we actually saw this used earlier when looking at strace. It will display all open files, and any one who knows a bit about operating systems will realise that an open file could in fact be any of the following:
- a regular file
- a directory
- a block special file
- a character special file
- an executing text reference
- a library
- a stream or a network file (Internet socket, NFS file or UNIX domain socket)
This means that lsof isn’t as pointless as you may have initially thought. Considering nearly everything in a *nix environment ‘is a file’ (including network sockets).
In order to use this command, let’s see some simple examples:
lsof -u <user>: filter results by specific userlsof -i TCP:22 -n: lists all running processes on port 22 (ssh)lsof -i 4: display only IPv4 network files
For example, with that last command (show the IPv4 network files) running on my Mac OS laptop, I see all sorts of processes such as: Slack, Chrome, Spotify etc. Lots of interesting information
This is one of those tools that might not get used very often, but when the right problem occurs it can be a real time saver being able to see what files your machine has open.
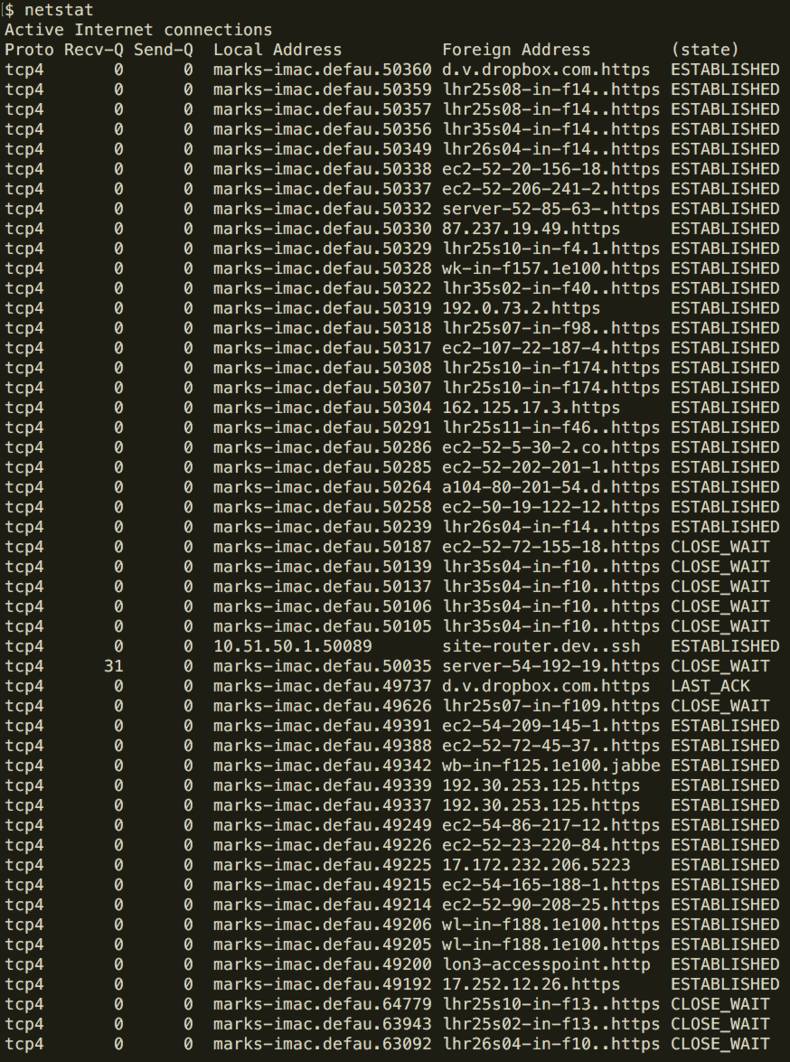
netstat
Summary: monitors network traffic
The netstat (network statistics) command is useful because it allows us to see network connections for TCP (both incoming and outgoing), routing tables, and a number of network interface and network protocol statistics.
This gives us an insight into what network communications are going on and whether certain services are talking to the right endpoints, how often and whether their connections are being established or terminated correctly.
Here are some useful examples you can try out:
-
netstat -a: show both listening and non-listening sockets (for TCP this means established connections) -
netstat -l: show just listening sockets -
netstat -lt: show just tcp sockets -
netstat -lu: show just udp sockets -
netstat -aep: extend to show the user and also the pids -
netstat -aepn: don’t translate host names (e.g. show ip instead) -
netstat -aepT: show host name but don’t truncate it -
netstat -ax: show just UNIX domain sockets -
netstat -st: shows summary of connections (useful for identifying TCP connection issues) -
netstat -lc <n_seconds>: show listening sockets whilst continously refreshing every n seconds -
netstat -atepn: nice ‘general’ all-rounder (see below for example output)Active Internet connections (servers and established) Proto Recv-Q Send-Q Local Address Foreign Address State User Inode PID/Program name tcp 0 0 0.0.0.0:8126 0.0.0.0:* LISTEN 0 8934 1071/statsd tcp 0 0 0.0.0.0:8080 0.0.0.0:* LISTEN 498 10087 1355/puma 2.14.0 (t tcp 0 0 0.0.0.0:22 0.0.0.0:* LISTEN 0 8763 1196/sshd tcp 0 0 127.0.0.1:24220 0.0.0.0:* LISTEN 497 9296 1307/ruby tcp 0 0 10.6.4.51:57228 10.6.31.176:6379 ESTABLISHED 498 218757 1355/puma 2.14.0 (t tcp 0 0 10.6.4.51:57224 10.6.31.176:6379 ESTABLISHED 498 218743 1355/puma 2.14.0 (t tcp 0 0 10.6.4.51:8080 10.6.8.80:48205 ESTABLISHED 498 229190 1355/puma 2.14.0 (t tcp 0 0 10.6.4.51:57231 10.6.31.176:6379 ESTABLISHED 498 218766 1355/puma 2.14.0 (t tcp 0 0 10.6.4.51:57225 10.6.31.176:6379 ESTABLISHED 498 218747 1355/puma 2.14.0 (t tcp 0 0 10.6.4.51:8080 10.6.6.76:51764 ESTABLISHED 498 10111 1355/puma 2.14.0 (t tcp 53 0 10.6.4.51:56870 54.231.142.40:443 ESTABLISHED 497 229141 1307/ruby tcp 1 0 127.0.0.1:34704 127.0.0.1:8080 CLOSE_WAIT 48 226010 20286/httpd -
netstat -r: shows routing table (see below for example output)Kernel IP routing table Destination Gateway Genmask Flags MSS Window irtt Iface 10.6.0.0 * 255.255.248.0 U 0 0 0 eth0 link-local * 255.255.0.0 U 0 0 0 eth0 default ip-xx-x-x-x.eu- 0.0.0.0 UG 0 0 0 eth0
Effectively, if you’ve any kind of network issues, then this tool can help you potentially identify where it’s coming from or going (or if it’s not coming from or going to the expected source/destination).
Update: an easy way to remember this (thanks Julia Evans - see honorable mentions is “tuna please”
netstat -tunapl). You can uselsof -i -Pon Mac OS
ifconfig
Summary: configure or review your network interfaces
The ifconfig command is used to configure or review your network interfaces and can help you identify if there is a problem with your network (such as no Ethernet or WiFi or maybe your connections are misbehaving due to misconfiguration).
Because networking is a big topic, and I’m not very good at it, I’ll refer you to the following article which provides a breakdown of typical data ouput: www.aboutlinux.info/2006/11/ifconfig-dissected-and-demystified
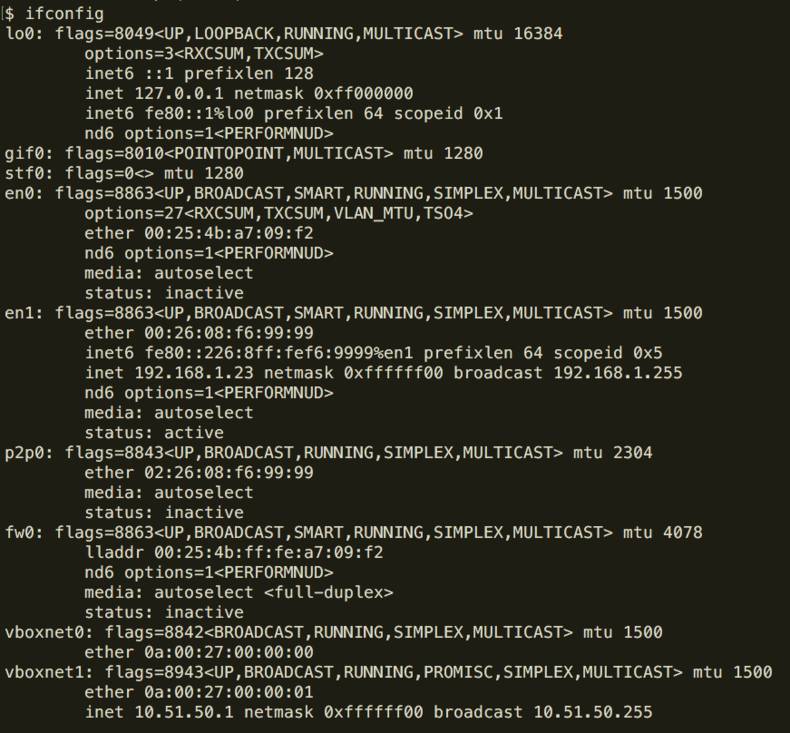
If you don’t want to configure a network interface, then running the ifconfig command without any arguments will display all existing network interfaces:
eth0      Link encap:Ethernet  HWaddr 0A:05:1E:A5:6F:FF
          inet addr:10.6.4.51  Bcast:10.6.7.255  Mask:255.255.248.0
          inet6 addr: fe80::805:1eff:fea5:6fff/64 Scope:Link
          UP BROADCAST RUNNING MULTICAST  MTU:9001  Metric:1
          RX packets:8776319 errors:0 dropped:0 overruns:0 frame:0
          TX packets:4212889 errors:0 dropped:0 overruns:0 carrier:0
          collisions:0 txqueuelen:1000
          RX bytes:10239965628 (9.5 GiB)  TX bytes:10967533931 (10.2 GiB)
          Interrupt:155

lo        Link encap:Local Loopback
          inet addr:127.0.0.1  Mask:255.0.0.0
          inet6 addr: ::1/128 Scope:Host
          UP LOOPBACK RUNNING  MTU:65536  Metric:1
          RX packets:341240 errors:0 dropped:0 overruns:0 frame:0
          TX packets:341240 errors:0 dropped:0 overruns:0 carrier:0
          collisions:0 txqueuelen:0
          RX bytes:31612016 (30.1 MiB)  TX bytes:31612016 (30.1 MiB)
We can see above that we have a single Ethernet card (eth0) and a loop back interface (lo)
In newer Linux OS’
eth<n>is replaced byp2p<n>
And on the Mac OS it becomesen<n>
If you want to find out which interface your WiFi is associated with, then you can use:
$ networksetup -listallhardwareports

Hardware Port: Wi-Fi
Device: en0
Ethernet Address: 38:f9:d3:9e:9f:2b

Hardware Port: Bluetooth PAN
Device: en6
Ethernet Address: 38:f9:d3:95:5c:fc

Hardware Port: Thunderbolt 1
Device: en1
Ethernet Address: 5a:00:5c:52:d9:01

Hardware Port: Thunderbolt 2
Device: en2
Ethernet Address: 5a:00:5c:52:d9:00

Hardware Port: Thunderbolt 3
Device: en3
Ethernet Address: 5a:00:5c:52:d9:05

Hardware Port: Thunderbolt 4
Device: en4
Ethernet Address: 5a:00:5c:52:d9:04

Hardware Port: Thunderbolt Bridge
Device: bridge0
Ethernet Address: 5a:00:5c:52:d9:01

VLAN Configurations
===================
For more information on Network ips and how they’re created (i.e. CIDRs), then you might be interested in this quick gist (but it’s only basic information, so you might have better luck with your own Googling)
iftop
Summary: monitors network traffic and displays table of bandwidth usage
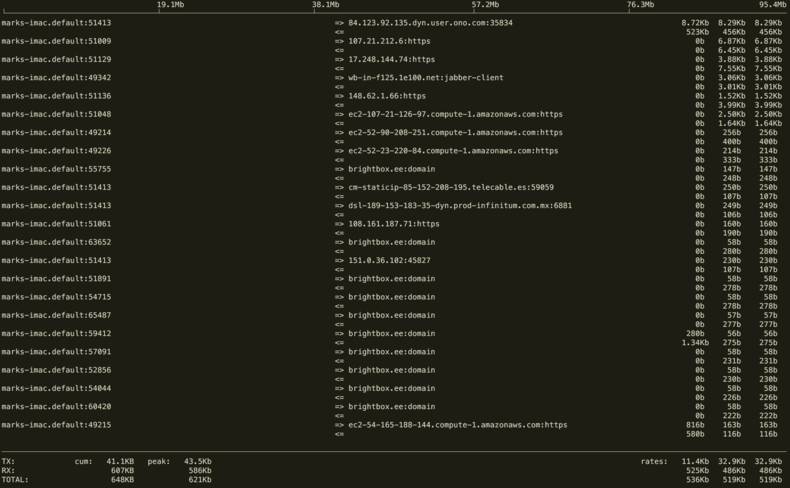
The iftop command is useful for identifying things like “why is our connection so slow?”. It’s equivalent to a tool like top when understanding CPU usage.
The command listens to network traffic on a named interface and displays a table of current bandwidth usage by pairs of hosts.
This utility isn’t available by default on any OS, so with Mac OS:
brew install iftop
With Ubuntu:
apt-get update && apt-get install iftop
With CentOS:
yum install wget libpcap -y
wget http://pkgs.repoforge.org/iftop/iftop-0.17-1.el6.rf.x86_64.rpm
rpm -ivh iftop-0.17-1.el6.rf.x86_64.rpm
Below is a simple command to get you started:
sudo iftop -P -i en1
Note: use
ifconfigto find the interface you’re interested in
I personally find the standard output useful (as per image above), but if you press ? while the program is running you’ll see lots of additional options you can try:
Host display:                          General:
 n - toggle DNS host resolution         P - pause display
 s - toggle show source host            h - toggle this help display
 d - toggle show destination host       b - toggle bar graph display
 t - cycle line display mode            B - cycle bar graph average
                                        T - toggle cumulative line totals
Port display:                           j/k - scroll display
 N - toggle service resolution          f - edit filter code
 S - toggle show source port            l - set screen filter
 D - toggle show destination port       L - lin/log scales
 p - toggle port display                ! - shell command
                                        q - quit
Sorting:
 1/2/3 - sort by 1st/2nd/3rd column
 < - sort by source name
 > - sort by dest name
 o - freeze current order
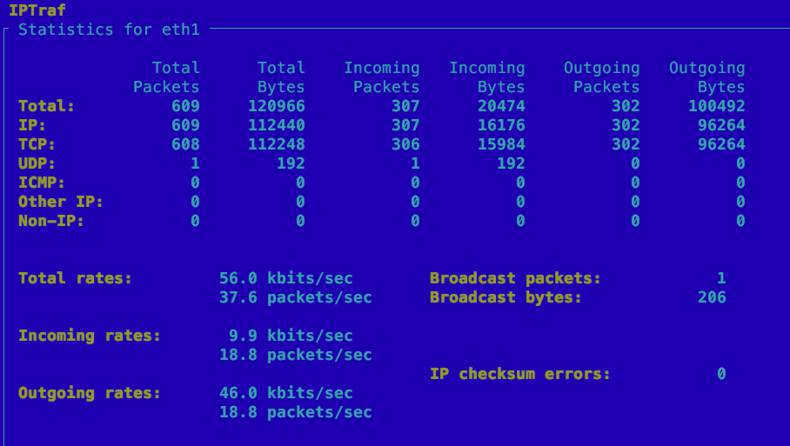
iptraf
Summary: monitors network traffic (more visual than netstat, but not as detailed)
This utility isn’t available on Mac OS, so you’ll need Linux:
With Ubuntu:
apt-get update && apt-get install iptraf
With CentOS:
yum install iptraf
Because iptraf requires a lot of user interaction to get into different sections of the tool, I’ll have to just leave it up to you to explore.
But you’ll see options like IP traffic monitor, which can be useful viewing. Personally I don’t find iptraf as useful as tools such as iftop. But it’s here for you nonetheless.
tcpdump
Summary: network packet sniffer
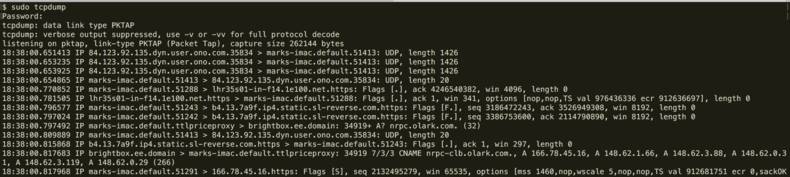
tcpdump is a powerful and widely used command-line package analyzer, which is used to capture or filter TCP/IP packets received or transferred over a network on a specific interface.
We can save the output of this program into a pcap file format, that can then be viewed by either tcpdump itself or via an open source GUI based tool such as Wireshark that reads pcap format files and visualises the data.
The following are some examples to help you understand how to execute tcpdump, but be aware that on some hosts you might need to run it with sudo:
tcpdump -D: show available network interfacestcpdump -i eth0 -c 5: capture n packets from specific network interfacetcpdump -i eth0 -c 5 -w 0001.pcap: send output to pcap filetcpdump -r 0001.pcap: read back out the pcap file content for later analysistcpdump -n -i eth0 -c 1: converts dns hostnames into ip addresses insteadtcpdump -n -i eth0 -c 10 tcp: capture only tcp packetstcpdump -n -i eth0 -c 10 port 22 and port 80: capture packets from specific portstcpdump -i eth0 src <ip>: capture packets from a specific source iptcpdump -i eth0 dst <ip>: capture packets for a specific destination iptcpdump -i eth0 src port 80 or dst port 80: filter all HTTP traffic to or from port 80tcpdump -i eth0 -s 0: include contents of each packet (not just the packet header)tcpdump -vvv -s 0 -l -n port 53 -XX: watch all DNS traffic (which happens on port 53)
If you run tcpdump on a remote server, you’ll want to use the
-wflag to record the data into a pcap file, this is so you can scp the file back to your local machine for later aggregation/analysis with either tcpdump itself (-r) or by importing the pcap file into another tool such aswiresharkortshark
The output of the program may look a little confusing but there is consistent structure you can look out for:
<date_time> <protocol> <src> > <dest>: Flags[<type>] <data>
Note: the
>always sits betweensrcanddestand indicates the direction of the request
Flags
Flags aren’t always present, depending on the network transfer that has been recorded, but when it is you’ll usually see one of the following:
[U] URG: used to identify incoming data as ‘urgent’. Such incoming segments do not have to wait until the previous segments are consumed by the receiving end but are sent directly and processed immediately[A] ACK: the receiver will send an ACK that equals the senders sequence number[P] PSH: push exists to ensure that the data is given the priority (used quite frequently at the beginning and end of a data transfer, affecting the way the data is handled at both ends)[R] RST: used when a segment arrives that is not intended for the current connection (remote host rejects packet and resets connection)[S] SYN: initially sent when establishing the classic 3-way handshake between two hosts (one sent by Host A and one sent back with ACK by Host B)[F] FIN: used to tear down the virtual connections created using the previous flag (SYN)
Data
You’ll typically see more information within the ‘data’ output to indicate information about the packets being passed between hosts.
One such example would be seeing win specified. This is a sliding ‘window’ that represents the size of the packets being sent back and forth.
You’ll also typically see an ACK (acknowledgement packet), and that it won’t be sent until the previous packet has been completely received (this is to help with consistency of specific sequence numbers and the ability to signify packets have been missed).
The win is also used for flow control. An example of this is where one end of the communication is having trouble keeping up with the number of packets and so they modify the window buffer to be a smaller packet size to allow themselves to catch up with their processing of data.
Last Packet?
Although nothing to do with tcpdump, it is worth understanding (for the sake of debugging) that the FIN flag doesn’t necessarily indicate the last packet has just been sent. Here is an example to explain:
- Host A receives what it believes to be the last data packet
- So Host A sends a
FINto tell Host B it’s closing its connection, along with anACKto acknowledge Host B’s last data packet - Host B sends an
ACKto acknowledge receipt of Host A’sFIN - Host B then sends its own
FINandACKto close its connection down - Host A sends a final
ACKto acknowledge Host B’s last communication was received
wireshark
Summary: network packet sniffer and analyser (gui)
Wireshark is a network protocol analyzer.
It lets you see what’s happening on your network at a microscopic level.

There’s not a lot I can say about Wireshark other than you really will need to know how certain network protocols (such as TCP) work in order to understand the output that’s being recorded.
The output will look very similar to what tcpdump provides (depending on what network traffic you’re recording), and is a really useful tool for easier interrogation of pcap files created by tcpdump.
This utility isn’t available by default on any OS, so with Mac OS:
brew install wireshark --with-qt5
Note: sometimes the flags that are available change. So I would suggest running the command
brew cat wiresharkfirst to see what’s available first.
With Ubuntu:
apt-get update && apt-get install wireshark
With CentOS:
yum install wireshark
I typically have only ever used Wireshark with pcap files I’ve created via tcpdump so that’s what I’ll demonstrate here. There are two ways to open the pcap file in Wireshark.
-
execute
wiresharkfrom the terminal, which will open the gui, and from the gui interface select “Open Capture File”. -
execute
wireshark -r /path/to/pcap/file
Note: if you just want to use Wireshark to monitor all network traffic, then execute
sudo wireshark -i <interface>(useifconfigorsudo wireshark -Dto see what interfaces are available). Once the gui is open it’ll have the specified interface pre-selected, so just double-click on it to start recording its traffic
Every time there is (for example) a HTTP request, there might end up being 200 TCP packets recorded, which can be (as you could imagine) difficult to recognize and make sense of manually.
But this problem can be simplified within Wireshark by clicking on “Statistics” and then “Conversations”, where it will organize all these disparate packets into TCP sessions for you. Thus making analysing the data much easier.
Note: we cover ‘filtering’ more in the next section about tshark, but one simple search for a HTTP GET header in your recorded traffic is
frame contains "GET"
Docker?
One thing I did notice when trying to use this tool with Docker, was that you must run the container in privileged mode:
docker run --privileged
Otherwise you’ll see:
can't run /usr/sbin/dumpcap: Operation not permitted
Apparently --security-opt seccomp:unconfined is an alternative option.
The following is taken and paraphrased from the Docker website:
Doing this will allow Docker to access all devices on the host as well as set some configuration to allow the container to nearly all the same access to the host as processes running outside the containers on the host.
For more details, please refer to the documentation.
tshark
Summary: network packet sniffer and analyser (cli version of wireshark)
Tshark is a network protocol analyzer, but a terminal based one.
It lets you see what’s happening on your network at a microscopic level.
As mentioned above in the Wireshark section, to get access to tshark on the Mac OS you need to install Wireshark. There are separate installs though for other OS’.
With Ubuntu:
apt-get update && apt-get install tshark
With CentOS:
yum install tshark
I’ve only used tshark a few times and typically I find using the Wireshark gui better for interpretting tcpdump data (which has so far been one of my primary use cases; e.g. debugging traffic occuring on a remote server).
But the benefit of tshark, outside of those of us who love living inside the terminal, is the ability to automate analysis without the need for a gui. This means we can write scripts to process the data we’ve recorded and so becomes a very powerful tool.
Similar to Wireshark, if you want to read in a pcap file then you would use the -r flag to point to its location on your file system:
tshark -r /path/to/pcap/file
Also you can just run tshark and have it monitor all network traffic on your host machine or just a specific interface (using the -i flag). There is also the -D flag for having it show you all available interfaces you can listen on.
The tshark command knows a lot more about what’s going on inside your TCP packets than tcpdump and so you have more options available to you in order to filter out the data you’re interested in:
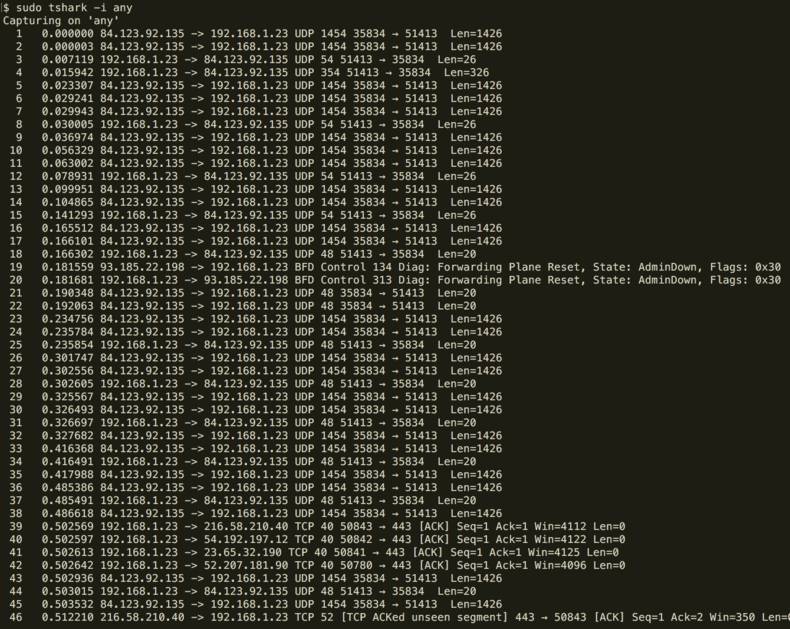
sudo tshark -i any \
            -R 'http.request.method == "GET"' \
            -T fields \
            -e http.request.method -e http.request.uri -e ip.dst
In the above example we’re ’explicitly’ listening on all interfaces for network traffic. We then filter out all packets except those which are a HTTP GET request.
Now instead of just showing all the data for the HTTP GET requests that come through we use the -T flag to indicate that we’re interested only in ‘fields’ being displayed. We then can use the -e flag to indicate which subset of ‘fields’ we want to show.
In this case we’ve chosen to display the request method (i.e. GET), the URI that was associated with the GET and the ip address associated with it.
Filtering Example
One very real example I had recently was the need to inspect DNS traffic and to identify the TTL record values returned by the DNS resolutions happening on port 53.
I had used tcpdump to record the relevant traffic:
tcpdump -vvv -s 0 -l -n port 53 -XX -w dns-traffic.pcap
I then was able to pass this into tshark to automate the extraction of useful data, all without having to consult the Wireshark gui (meaning I could do this within the same environment as the data was recorded in if I wanted to):
tshark -r ~/dns-traffic.pcap -T fields -e dns.resp.ttl -e dns.resp.name
One useful trick some people aren’t aware of, is that if you are writing automation scripts with tshark but you’re unsure of how to access specific data fields, then just use Wireshark temporarily to figure out the fields you need.
For example, if you open the pcap in wireshark, you can find the filter you need by selecting the data manually via the UI and then right-click’ing the relevant data field and selecting “Prepare a Filter > Selected”. This will generate the exact value you would assign to the tshark -e flag.
Note: the filtering system syntax is called BPF (Berkeley Packet Filter) and you can find documentation here
telnet
Summary: utility for communicating with another host
Telnet is both a tool telnet and a Network Protocol of the same name: Telnet. The telnet program is used for interactive communication to a remote/external host on a given port. Once the connection to the remote host is established, an HTTP request can be sent to the host by typing it in the prompt.
Telnet’s usage nowadays is a little limited due to the massive success of protocols such as SSH, but it can be interesting to play around with (although I’ve never really had much of a ’need’ for it myself).
Note: one such tool that is more useful in this respect is
netcatwhich reads and writes data across network connections, using the TCP or UDP protocols
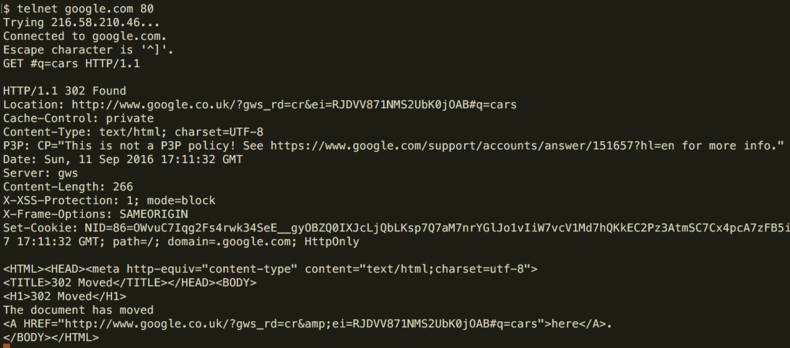
To use the command you type telnet <host> <port>. Once ‘connected’ to the host you need to provide a command to be executed, for example a GET request.
Below is an example of making a GET request. First we must connect:
telnet www.google.com 80
We will get the following response:
Trying 87.237.19.30...
Connected to www.google.com.
Escape character is '^]'.
From here we can provide our request:
GET #q=cars HTTP/1.1
Note: you need to press
twice to send the request
From here we get the following response:
HTTP/1.1 302 Found
Location: http://www.google.co.uk/?gws_rd=cr&ei=k7BjV-GbFOLOgAbd3JbADw#q=cars
Cache-Control: private
Content-Type: text/html; charset=UTF-8
P3P: CP="This is not a P3P policy! See https://www.google.com/support/accounts/answer/151657?hl=en for more info."
Date: Fri, 17 Jun 2016 08:10:59 GMT
Server: gws
Content-Length: 268
X-XSS-Protection: 1; mode=block
X-Frame-Options: SAMEORIGIN
Set-Cookie: NID=80=R8K0WhuF432ccZzjpchtEPHx-vv1n-9tuoe8P6V2yyNC2h1sd_JB7Q1afFZPo5W9MjvP8UL1ZZ_8UQDHeb3OpGDRNlSNfPkJWqE9JKa9hAJG02wlk7s8eIRy786p7-8U; expires=Sat, 17-Dec-2016 08:10:59 GMT; path=/; domain=.google.com; HttpOnly
<HTML><HEAD><meta http-equiv="content-type" content="text/html;charset=utf-8">
<TITLE>302 Moved</TITLE></HEAD><BODY>
<H1>302 Moved</H1>
The document has moved
<A HREF="http://www.google.co.uk/?gws_rd=cr&ei=k7BjV-GbFOLOgAbd3JbADw#q=cars">here</A>.
</BODY></HTML>
Connection closed by foreign host.
If we try a similar request with the BBC site, we’ll see we get a 404 not found:
$ telnet www.bbc.co.uk 80
Trying 212.58.244.66...
Connected to www.bbc.net.uk.
Escape character is '^]'.
GET /news HTTP/1.1

HTTP/1.1 404 Not Found
Content-Type: text/html
Date: Fri, 17 Jun 2016 08:13:29 GMT
Connection: Keep-Alive
Content-Length: 50591
Honorable mentions
A few months after writing this article I stumbled across a similar (but much better) post from Julia Evans. I then realised she has written lots of amazing posts, so you should check them out.
Here are some tools that she mentions that you should consider looking at:
- dstat: prints network/disk usage every second
- opensnoop: prints files being opened (but without strace perf concerns)
- netcat: connect, listen, tunnel with ease
- ngrep: provides grep functionality for the network
- perf: records a program on an interval for later analysis (also
perf top)
Conclusion
There you have it. A whirlwind run down of different terminal based debugging tools. The primary one’s (for me) being:
stracetcpdumpwiresharktshark
Obivously they all have their specialisms and unique features. I’ve not even scratched the surface of what they can do. If you know of anything really useful that I’ve missed, then let me know.
But before we wrap up... time (once again) for some self-promotion 🙊